A maintenance budget can look reasonable on paper while a small group of assets quietly consumes a large share of the available funds. Frequent repairs, emergency service calls, replacement parts, and unexpected downtime can push maintenance costs higher without making the underlying problem obvious.
Companies need more than a total maintenance spend to understand where their money goes. They must track expenses at the individual asset level and compare them with operating hours, breakdown frequency, and equipment reliability.
Maintenance budget analysis helps identify assets that cost more than expected, uncover the reasons behind rising expenses, and determine whether equipment needs better maintenance, corrective action, or replacement. The goal is not simply to reduce spending but to get better value from every maintenance dollar.
Which Assets Are Consuming More Than Their Fair Share?
The first step is to identify how much each asset costs to maintain. A facility may track its annual maintenance budget, but that figure alone cannot reveal whether one machine is responsible for an unusually large share of expenses.
Track the Total Maintenance Cost per Asset
An asset’s maintenance cost includes more than the amount paid for spare parts or external repairs. A useful calculation should consider:
- Labor costs: Time spent by technicians on inspections, servicing, troubleshooting, and repairs.
- Spare parts and consumables: Components, lubricants, filters, belts, and other materials used during maintenance.
- External service costs: Payments to contractors, specialist technicians, and equipment service providers.
- Preventive maintenance costs: Scheduled inspections, servicing, testing, and component replacements.
- Corrective maintenance costs: Repairs required after a fault or breakdown occurs.
- Downtime costs: Measurable losses caused by equipment being unavailable, such as lost production or service interruptions.
Tracking these expenses against individual assets helps companies understand their actual maintenance burden. It also makes it easier to identify equipment that repeatedly requires emergency repairs or expensive replacement components.
Compare Maintenance Spending With Asset Usage and Value
An asset with high maintenance expenses is not automatically a poor investment. Heavy-use equipment may naturally require more servicing than a machine that operates for only a few hours each week.
Companies should compare costs with operating conditions and equipment value. Useful measures include:
- Maintenance cost per operating hour: Total maintenance cost divided by operating hours.
- Maintenance cost as a percentage of replacement value: Annual maintenance expenses divided by the estimated cost of replacing the asset, multiplied by 100.
- Corrective-to-preventive maintenance ratio: The proportion of maintenance spending or work orders associated with unplanned repairs compared with scheduled maintenance.
These measures provide a more balanced view of asset performance. For example, a production machine that operates around the clock may have higher annual maintenance costs than a standby pump. However, if the pump requires frequent emergency repairs despite limited use, it may deserve closer investigation.
Companies should also look beyond the largest individual repair invoice. Several small repairs, repeated technician visits, and frequent component replacements can create a substantial expense over time.
How Can Companies Tell Whether High Spending Signals a Real Problem?
Identifying expensive assets is only the beginning. The next step is to determine whether their maintenance costs are reasonable for their age, workload, and operating environment.
An asset that requires regular servicing may be operating as expected. Another asset with similar responsibilities may be consuming more money because of recurring faults, poor installation, or ineffective maintenance practices.
Connect Maintenance Costs With Breakdowns and Downtime
Maintenance spending becomes more meaningful when companies compare it with equipment reliability. Consider tracking these indicators:
- Corrective work orders: How often does the asset require unplanned repairs?
- Mean Time Between Failures (MTBF): How long does the asset typically operate between failures?
- Mean Time to Repair (MTTR): How long does it take to restore the asset after a failure?
- Downtime hours: How much operating time is lost because of equipment problems?
- Repeat failures: Are the same components or faults appearing in multiple work orders?
When costs and reliability indicators are reviewed together, patterns become easier to recognize. For example, a machine may have moderate repair expenses but cause several hours of production downtime each month. Another machine may require expensive annual servicing but operate reliably throughout the year. Looking at repair invoices alone could lead the company to prioritize the wrong asset.
The following example illustrates how asset-level comparisons can support better decisions.
| Performance Indicator | Asset A | Asset B |
| Annual maintenance cost | ₹1,20,000 | ₹2,80,000 |
| Annual operating hours | 3,000 | 2,800 |
| Corrective work orders | 4 | 12 |
| Annual downtime | 8 hours | 36 hours |
Note: These figures are illustrative examples, not industry benchmarks.
Asset B costs more to maintain despite operating for fewer hours. It also has more corrective work orders and substantially more downtime. This combination suggests that Asset B needs further investigation. The company should examine its repair history, component failures, and operating conditions before deciding whether to change its maintenance strategy or consider replacement.
Separate Normal Wear From Avoidable Costs
High maintenance expenses do not always indicate poor performance. Equipment age, operating intensity, environmental conditions, and manufacturer recommendations all influence maintenance requirements.
For example, an air filter operating in a dusty industrial environment may need frequent replacement. That expense could be justified by the surrounding conditions.
However, a motor that repeatedly fails because of poor alignment presents a different problem. Replacing the motor each time may keep the equipment running temporarily, but it does not address the underlying cause.
Companies should review technician findings, inspection records, work order notes, and component replacement history to understand why costs are increasing.
The key is to distinguish necessary maintenance from recurring expenses that better planning or corrective action could prevent.
What Should Companies Do After Identifying High-Cost Assets?
Once companies identify assets with unusually high maintenance costs, they need to decide what action will deliver the best long-term result. Simply cutting the maintenance budget can increase breakdowns, create safety risks, and lead to even higher expenses.
Investigate the Cause Before Cutting Costs
Start by reviewing the asset’s maintenance history. Look for recurring faults, repeated component replacements, excessive emergency work orders, and unusually high labor hours.
Compare these findings with inspection results, operating conditions, and manufacturer recommendations. Where necessary, involve maintenance technicians and equipment specialists to determine whether the problem relates to asset condition, installation, usage, or maintenance procedures.
The investigation should lead to a clear action plan rather than another temporary repair.
Decide Whether to Repair, Improve, or Replace
Different assets require different responses.
- Improve the maintenance plan: Adjust inspection frequency, servicing intervals, or maintenance procedures when evidence supports the change.
- Correct the underlying problem: Address installation issues, operating practices, environmental conditions, or recurring component failures.
- Evaluate replacement: Compare future repair expenses, downtime risks, remaining useful life, and replacement costs before deciding whether continued maintenance is financially sensible.
For example, replacing an aging motor may appear expensive initially. However, if the motor requires repeated repairs and causes costly production interruptions, replacement could offer better long-term value.
Use CMMS Software for Better Cost Tracking
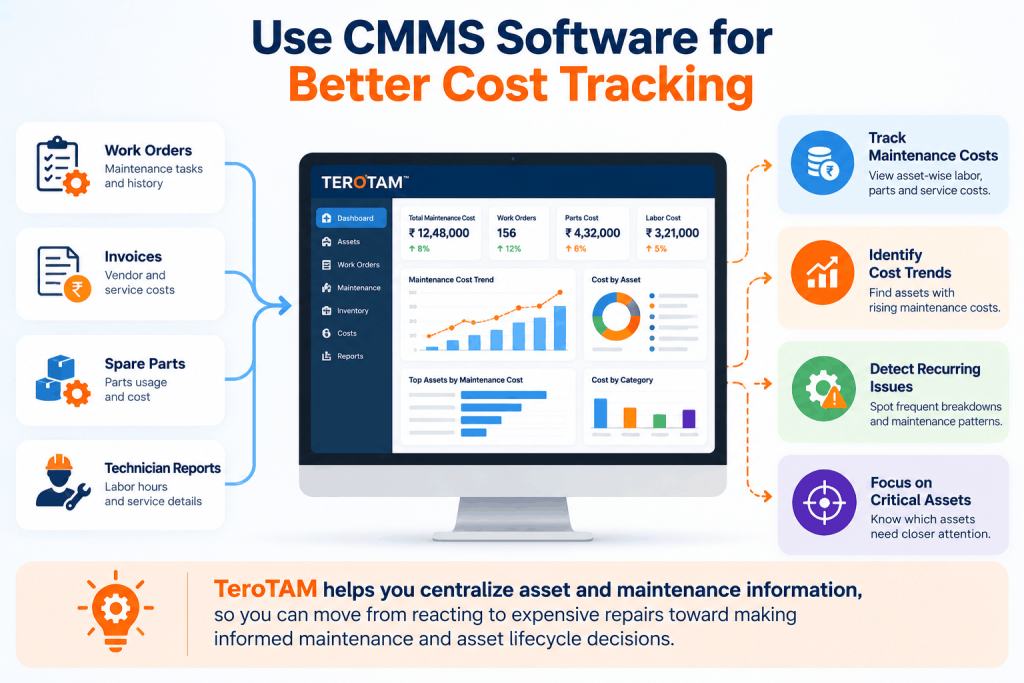
Maintaining accurate asset-level records can become difficult when work orders, invoices, spare parts, and technician reports are spread across different systems or spreadsheets.
A computerized maintenance management system (CMMS) connects these records and helps maintenance teams review asset history, track work orders, record labor and parts usage, and monitor maintenance costs over time.
TeroTAM helps organizations centralize asset and maintenance information, making it easier to review cost trends, identify recurring maintenance issues, and determine which assets need closer attention.
With consistent records, companies can move from reacting to expensive repairs toward making informed maintenance and asset lifecycle decisions.
Putting it to the end
Companies cannot identify their most expensive maintenance problems by looking at the overall maintenance budget alone. They need to track costs at the individual asset level and compare spending with operating hours, breakdown frequency, downtime, and equipment condition.
This approach helps distinguish normal maintenance requirements from avoidable expenses and supports better decisions about repairs, maintenance improvements, and replacement.
With accurate asset records and structured maintenance cost tracking, companies can control unnecessary spending without compromising equipment reliability.
Want to improve asset-level maintenance cost visibility? – Contact TeroTAM at contact@terotam.com to learn how CMMS software can help your team track maintenance expenses and make better asset management decisions.